Introduction
This is the documentation page for Gorilla Debug. The following sections describe how to setup and use this plugin.
Installation
You can install Gorilla Debug in any one of the following two ways
From your WordPress dashboard
- Visit Plugins -> Add New
- Search for Gorilla Debug
- Activate Gorilla Debug from your Plugins page
From WordPress.org
- Download Gorilla Debug
- Upload the
gorilla-debugdirectory to your/wp-content/plugins/directory - Activate Gorilla Debug from your Plugins page
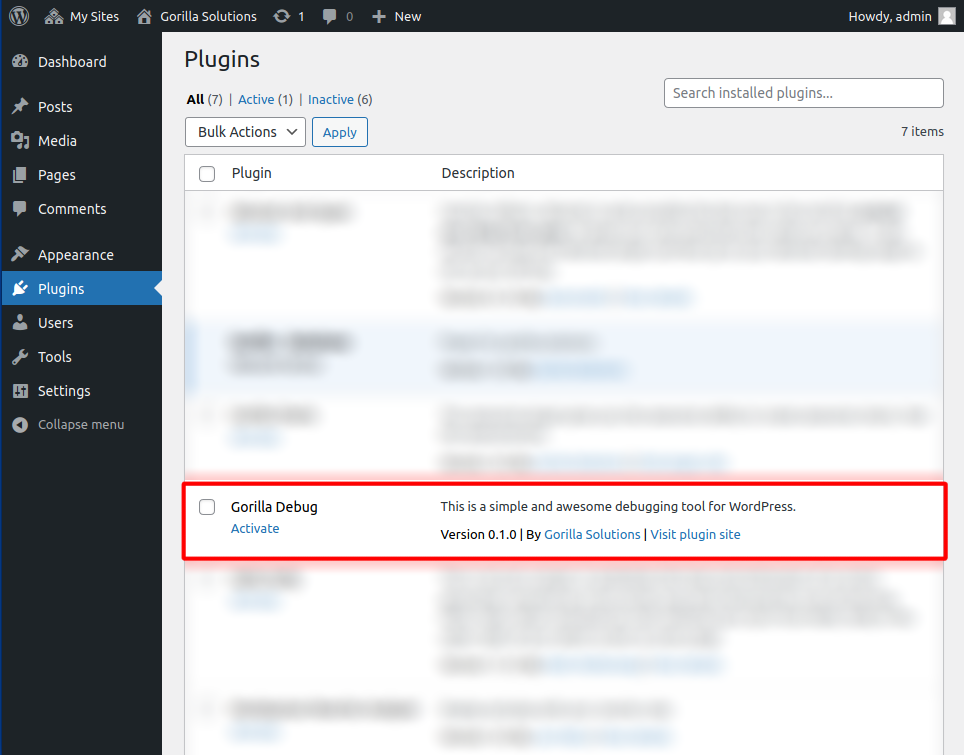
Activation
You activate the plugin similar to any other plugin simply by clicking on Activate. If you are activating in a multisite environment, then click on Network Activate.
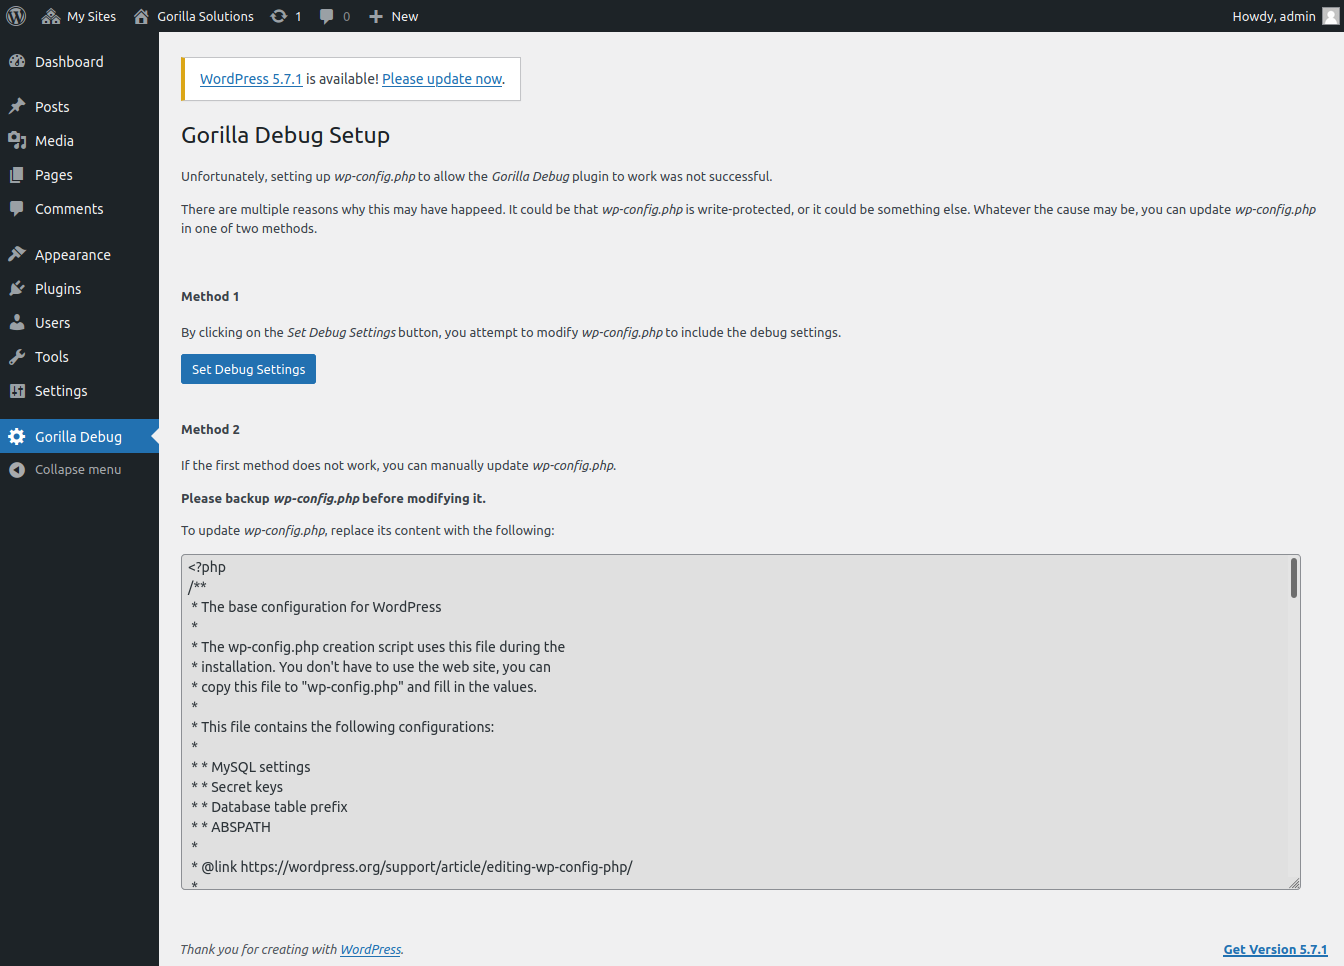
If the plugin cannot be activated
If you were unable to activate the plugin, it is most probably due to file write-protection and access permissions. If this happens, then you will be directed to the Gorilla Debug Setup page to manually finish the activation process of the plugin.
Remember, this plugin is for development purposes only, and if you decide to change file permissions to change the access privileges for wp-config.php, then it is better to do so in a secure development environment. If you need to use this plugin in a live environment, and you change your file permissions to allow this plugin to work, then you have to ensure that wp-config.php is protected again after you finish using this plugin.
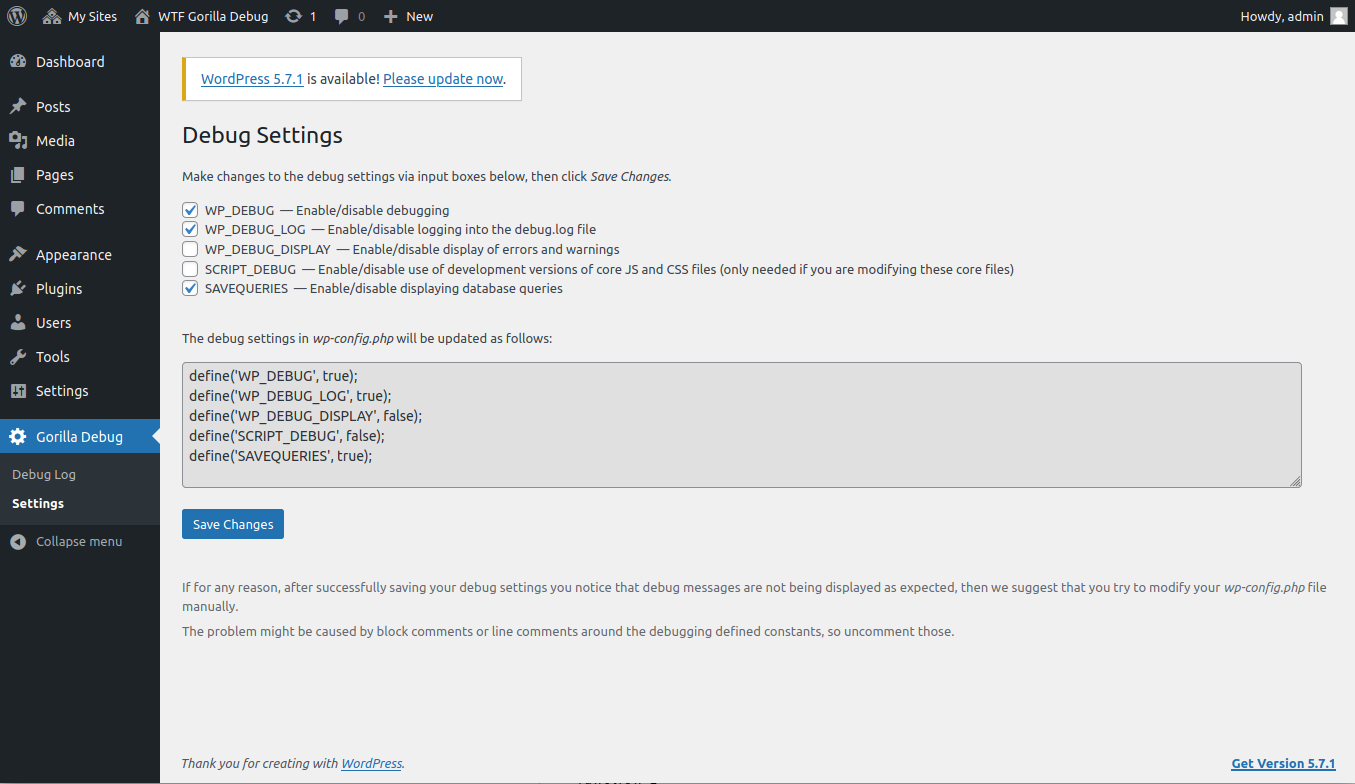
The bottom section of this page shows the changes that will be made to wp-config.php.
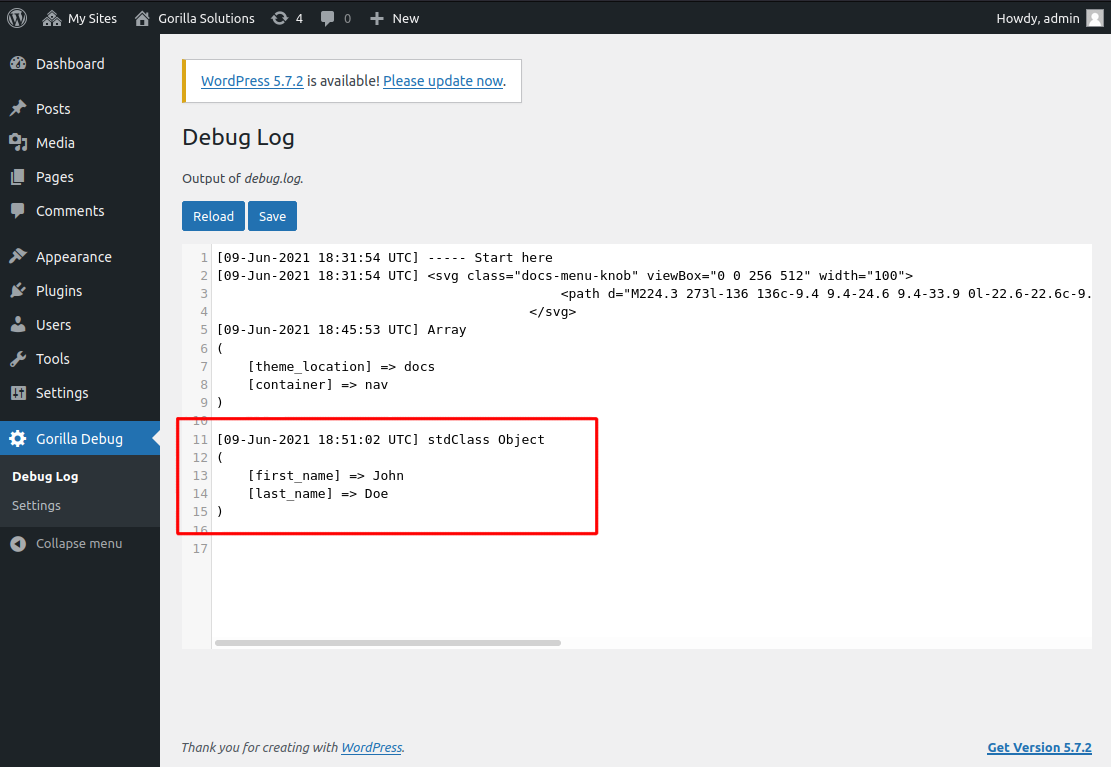
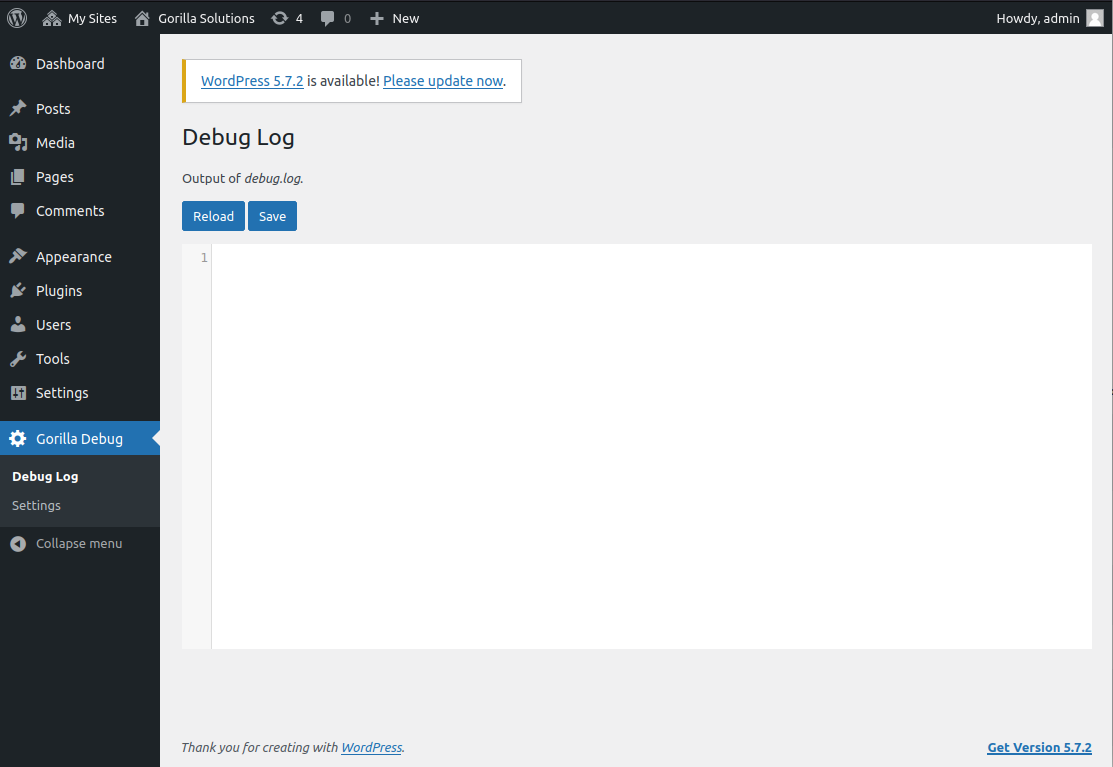
debug.log
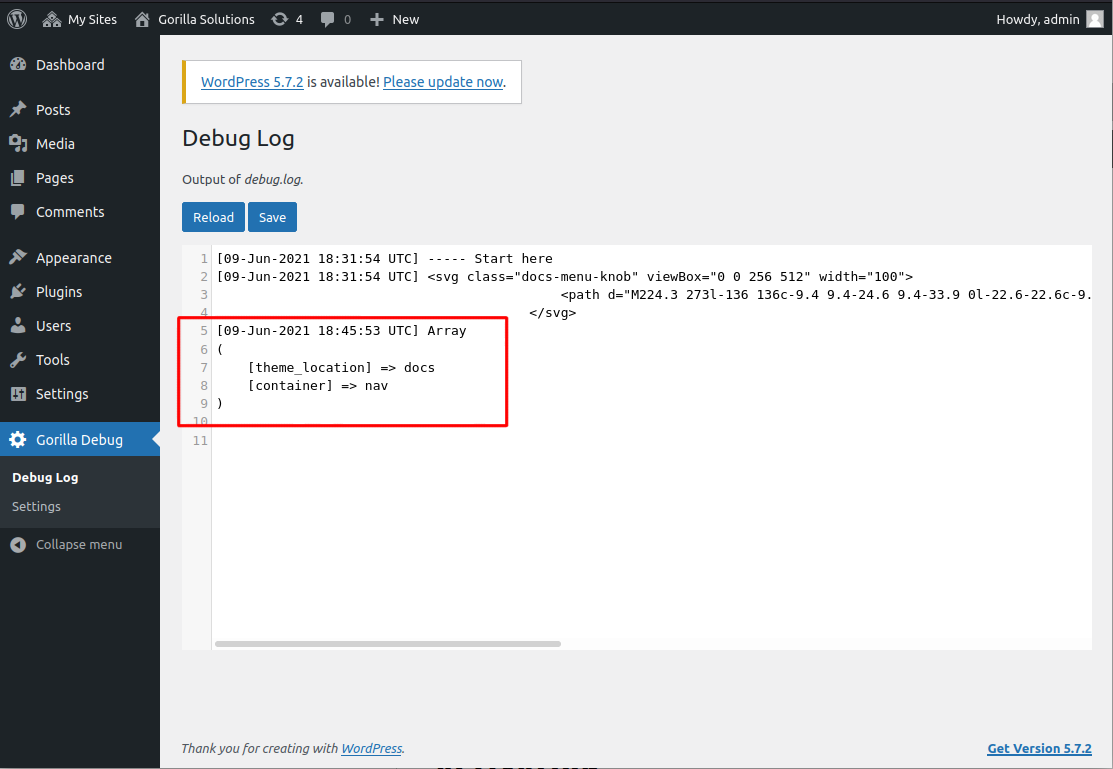
You can view the debug.log file by clicking on Gorilla Debug from the WP Admin panel. This page will show you the content of debug.log. Moreover, if debug.log changed at any point, you can reload the changes by clicking on the Reload button (please note that this page does not auto refresh, you have to click on Reload to get the latest changes). You can also modify the content of debug.log or reset the file by making completely empty, then click on Save to update debug.log with the new changes.
gorilla_debug()
Activating the Gorilla Debug plugin introduces a PHP debugging function, gorilla_debug(). You can call this from your PHP code to display messages, arrays, or objects either to the debug.log file or to the screen (depending on your debugging settings).
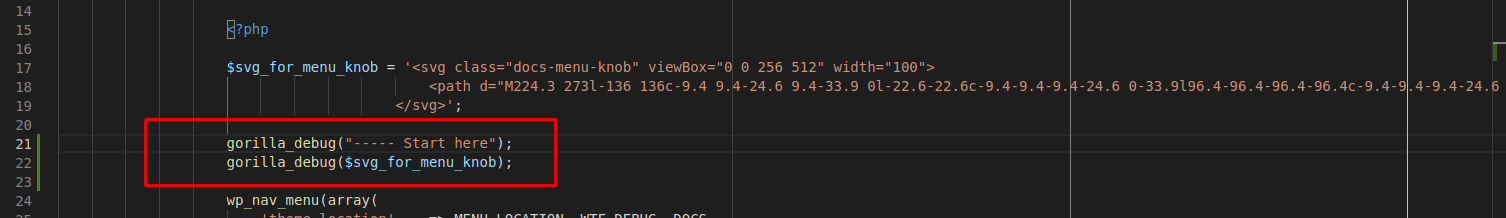
Here is an example of using this function to display text to debug.log. In this example, two calls are made to gorilla_debug() with text as input.
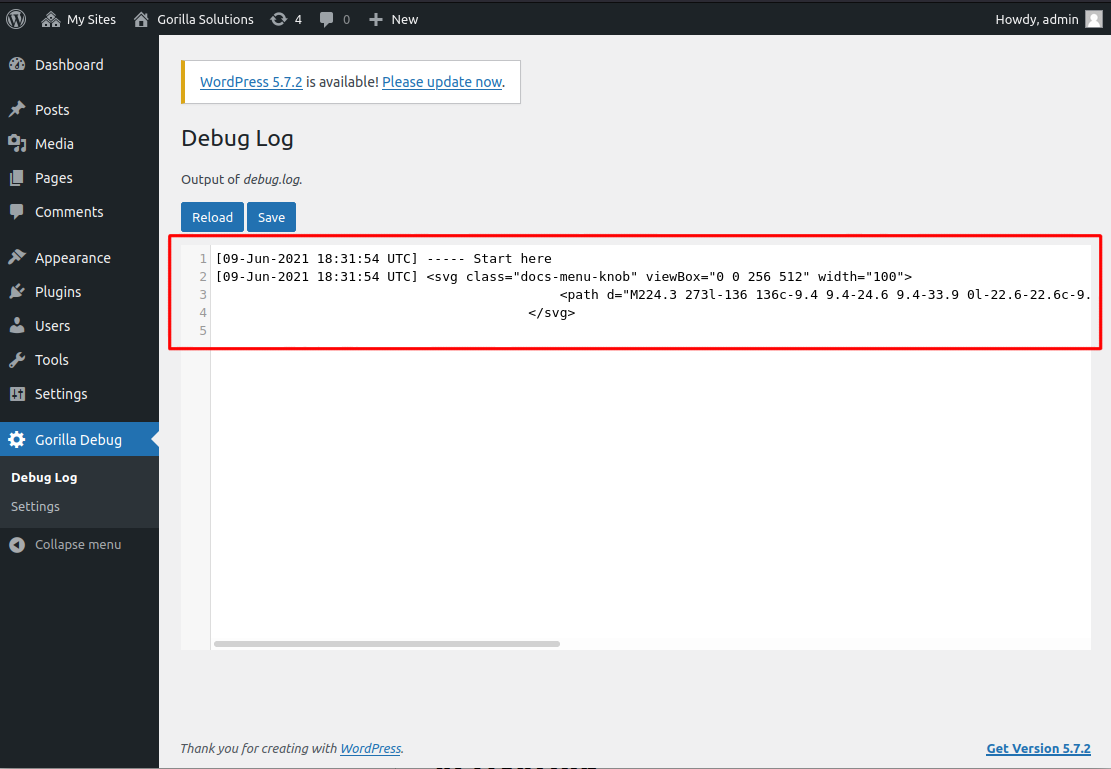
And the output of those calls as displayed in debug.log
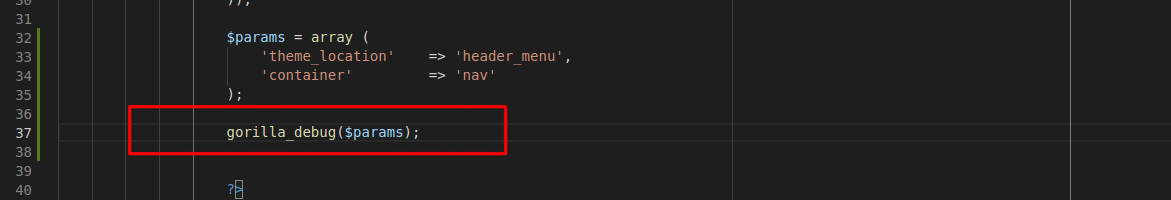
Here is another example, in which gorilla_debug() is called, but this time the input parameter is an array.
And debug.log for this call shows an array in the output.
And in this final example, gorilla_debug() is called with an object as input.
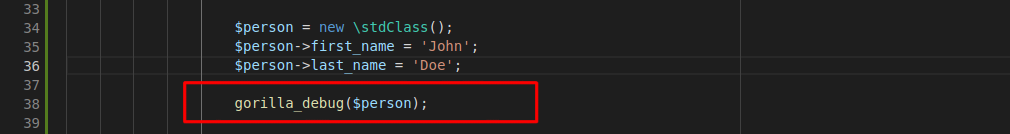
And debug.log for this call shows an object in the output.